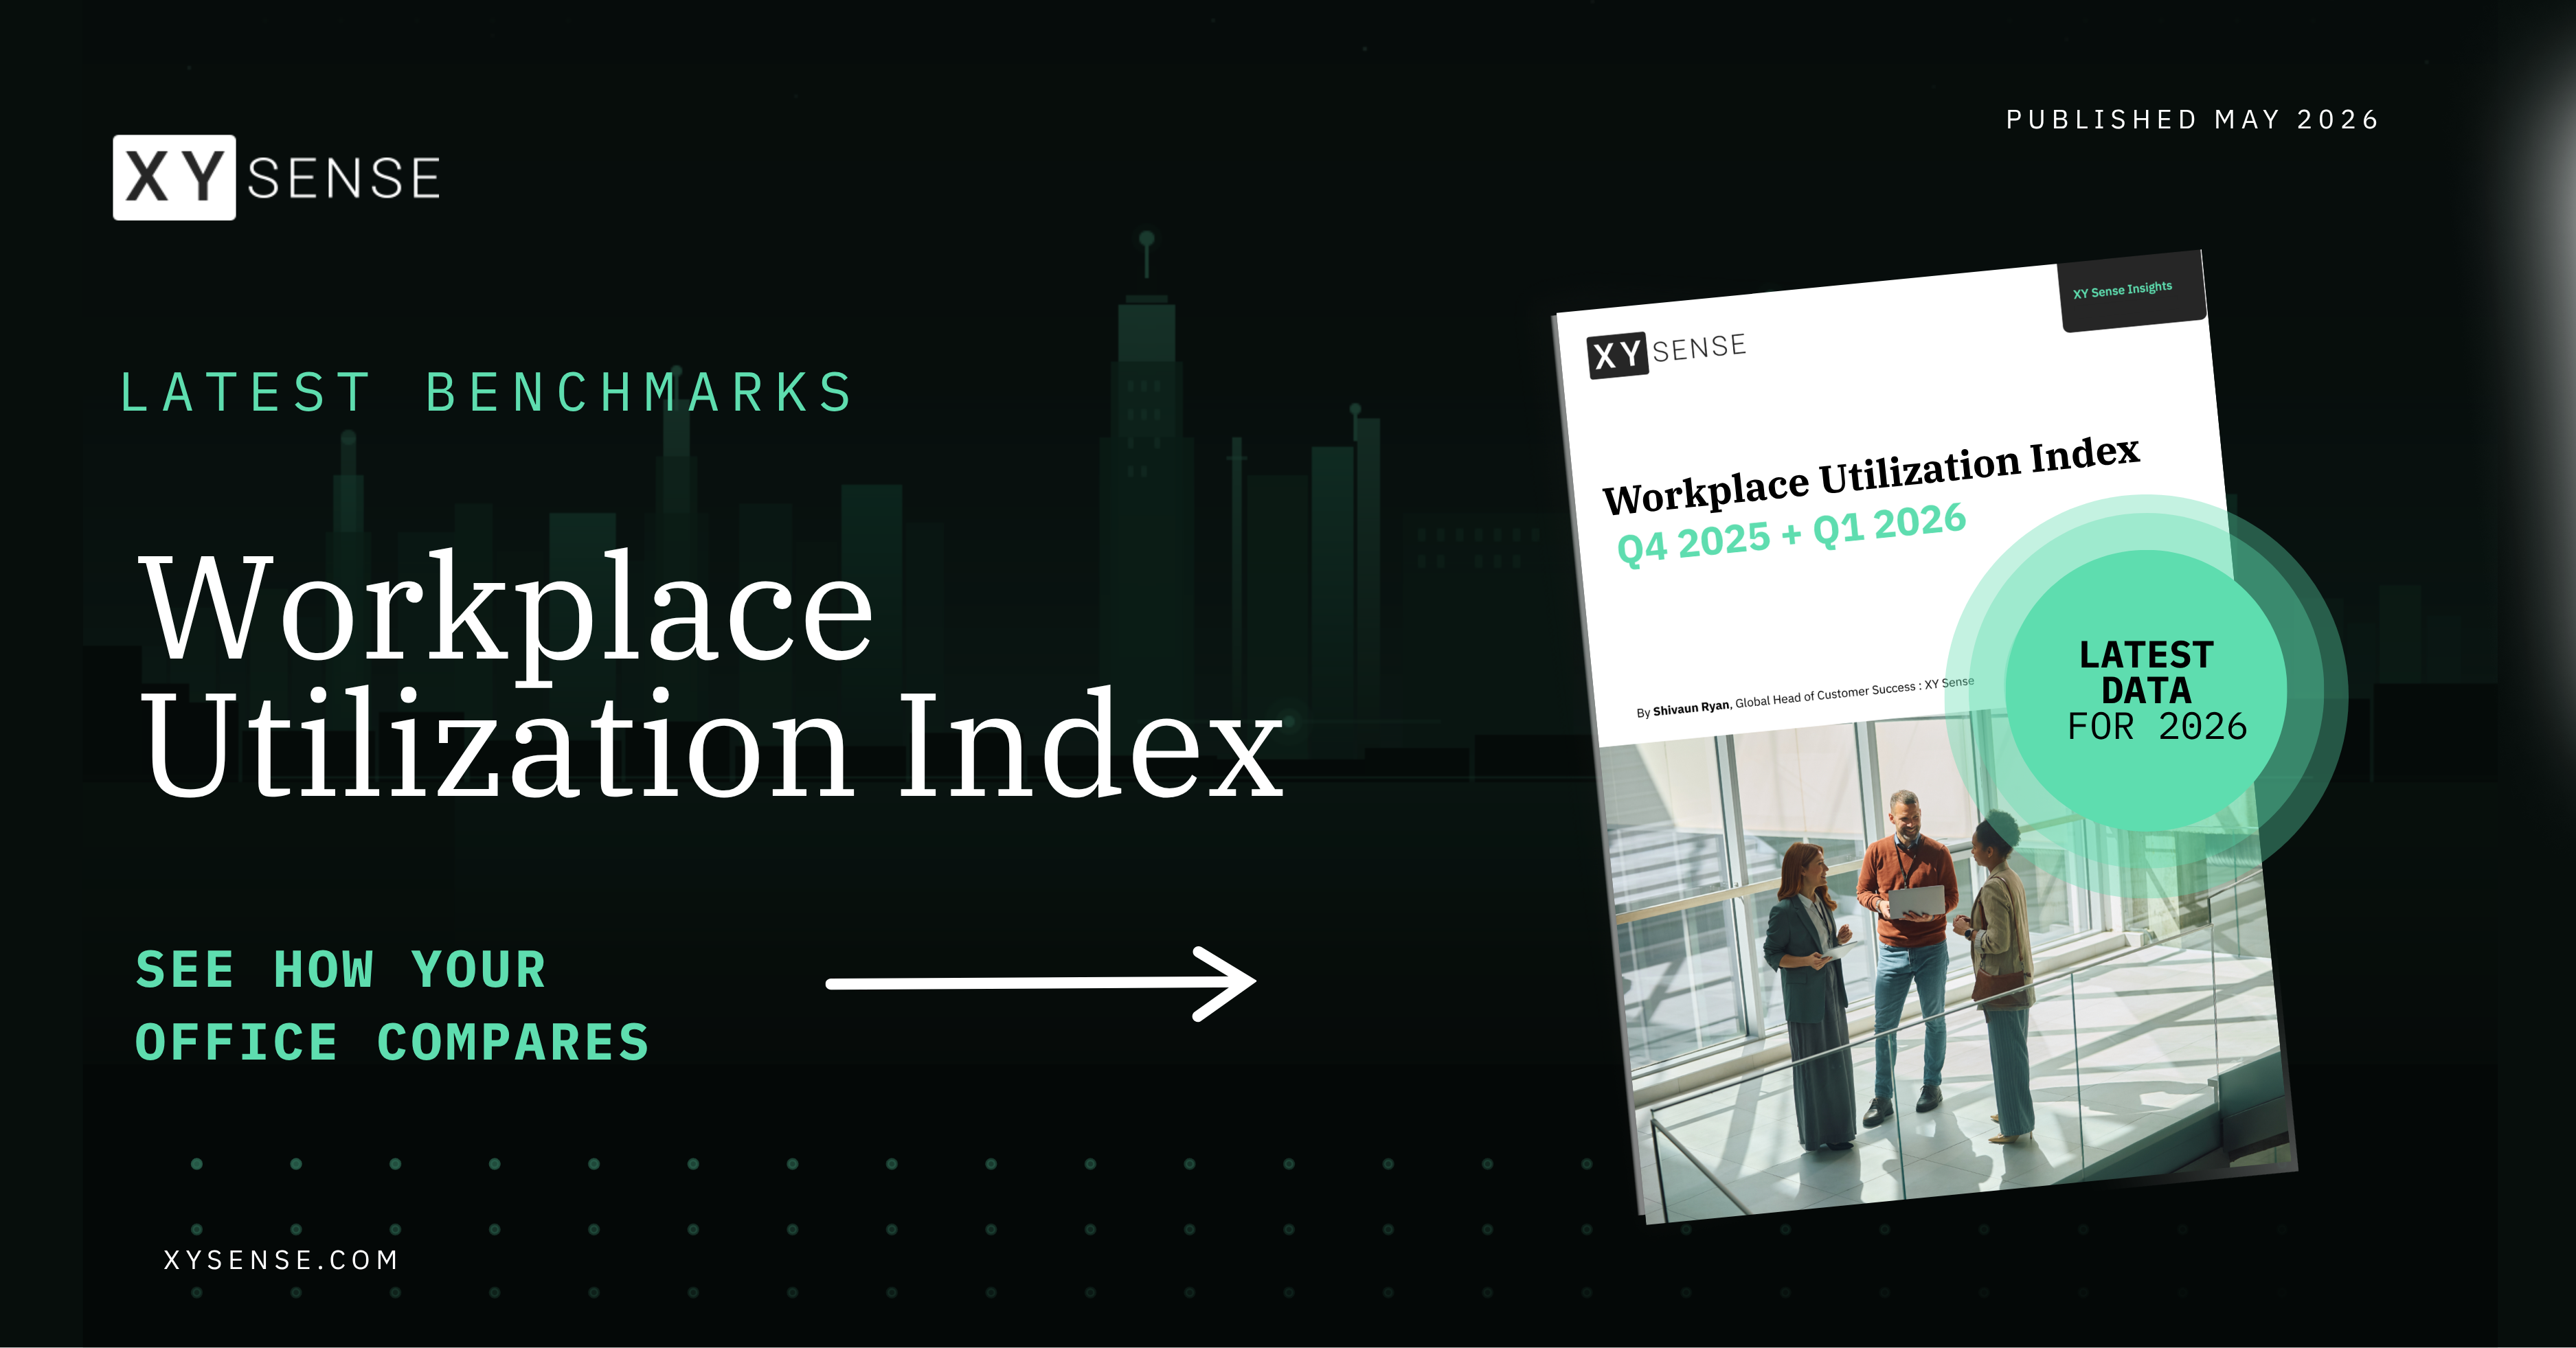
New benchmarks on workplace utilization provide CRE leaders with sharper data to support portfolio and operational decisions.
NEW YORK, NY, UNITED STATES, May 29, 2026 /EINPresswire.com/ — Enterprise offices are not facing a simple attendance problem, they are facing a mismatch between how workplaces are designed and how employees now use them. That is the central finding from the latest XY Sense Workplace Utilization Index, an in-depth sensor-based benchmark of global office usage available, drawing on anonymized data from over 63,000 workspaces across nine countries covering Q4 2025 and Q1 2026.
While overall office space utilization has continued to strengthen, demand remains heavily concentrated into peak midweek periods. Tuesday utilization reached 52% globally, while Friday held at 30%, a 22-point gap that has remained stable across multiple consecutive WUI editions.
At the same time, employees are consistently gravitating toward enclosed and acoustically private spaces. Meeting rooms averaged 56% utilization globally, phone booths and pods reached 52%, while open collaboration areas averaged just 30%.
The findings suggest many portfolios remain over-indexed toward desks and open-plan collaboration settings, while undersupplying the smaller enclosed spaces employees increasingly rely on for focused work, hybrid meetings, and video calls.
When demand concentrates on a Tuesday or Wednesday, the shortfall is experienced as friction: unavailable meeting rooms, competition for the right space type, and neighborhoods that feel overcrowded while adjacent zones sit empty. These are conditions that make the commute feel unjustified and that no RTO mandate resolves through policy alone.
The inverse problem is equally real. On days when overall occupancy runs below 30%, the building still consumes energy, lighting, heating, cooling, and services at rates calibrated to a fuller building.
“The teams delivering real workplace portfolio ROI today are using real-time occupancy intelligence to understand how their offices actually perform. They know which spaces people gravitate toward, which areas are avoided, and what environments genuinely support productive work. The gap is widening between organizations working from live behavioural data and those still relying on booking intent signals or data that stops at the front door.”
– Alex Birch, Co-Founder and CEO, XY Sense
Understanding the peak-day problem requires a different class of data to what most enterprise portfolios currently collect. Building entry counts and badge swipes at floor perimeters record how many people arrived. They do not record which spaces those people chose, which settings they avoided despite availability, or which room types were pressed into service for work they were never designed to support. Those behavioral patterns are where workplace teams unlock productivity gains, operational efficiency, and real estate cost savings.
Three findings from Q4 2025 and Q1 2026 are directly actionable for CRE leaders currently working through space decisions:
• Enclosed spaces are running at twice the utilization of open formats. Meeting rooms average 56% utilization on a given day. Phone booths and small pods reach 52%. Open collaboration areas sit at 30% and team breakout spaces at 27%. People gravitate consistently toward walls, a door, and functional AV. In most portfolios, supply of enclosed formats is insufficient relative to peak-day demand, which is exactly where friction concentrates. The open-plan collaboration zones that defined a wave of workplace redesign carry among the lowest utilization of any space type in the dataset.
• 94% of meetings involve six or fewer people, and nearly 40% involve just one. Single-occupant sessions – typically a video call, a focused work block, or a one-on-one conversation – require acoustic separation, not scale. Rooms designed for 10 to 14 people average 3 actual occupants per session. Rooms for 20 to 29 people average 4. The meeting room portfolio built around the exceptional event is systematically underserving the pattern that dominates every working day.
• 25% of desks go unused every day, despite rising attendance. A further 65% are occupied for under three hours. Only 17% see five or more hours of use. More people in the building is not producing more time at individual workstations. People are moving through a wider variety of settings, using desks for focused sprints of one to two hours between collaborative sessions.
Regional Context for CRE Portfolio Teams:
• Global average utilization reached 43% through 2025 and climbed to 45% by March 2026, up from 27% in 2023. Q1 2026 outperformed the same period in 2025 for the first time, indicating continued gradual strengthening.
• The United Kingdom leads all tracked markets at 55%. The United States recorded its strongest year-on-year gain, reaching 35% – up 8 points – as large employers accelerate the shift toward four- and five-day requirements. Canada reached 41%, gaining 17 points year-on-year. Most APAC markets held within two to three points of prior performance, indicating that hybrid work patterns have settled into predictable seasonal cycles.
• Monday continued its upward trend, reaching 41% globally. The clearest sign of policy-driven schedule change translating into sustained attendance patterns rather than concentrated midweek spikes alone.
The full XY Sense Workplace Utilization Index Q4 2025 and Q1 2026 is available now, covering regional and country-level utilization trends, weekday occupancy patterns, desk and meeting room insights, and analysis across 63,859 workspaces – alongside expert commentary and case studies from organizations leading workplace strategy transformation in 2026.
XY Sense is the actionable occupancy intelligence platform for corporate real estate teams. Our privacy-first, AI-powered sensors and Workplace Analytics Platform provides real-time workplace insights that help reduce real estate costs, improve space productivity, and create offices employees want to commute to. Coverage: 3,000 sqft (279m2) per sensor. Positional accuracy: under 1 ft. Cabling: approximately 80% less than traditional installations. All processing on-device; no images captured or stored. Deployed across 30+ countries with offices in Australia, US, UK, Dubai and India.
Rebecca Wood
XY Sense
marketing@xysense.com
Legal Disclaimer:
EIN Presswire provides this news content “as is” without warranty of any kind. We do not accept any responsibility or liability
for the accuracy, content, images, videos, licenses, completeness, legality, or reliability of the information contained in this
article. If you have any complaints or copyright issues related to this article, kindly contact the author above.

Media gallery